A Developer's Guide to Spring Boot 3 - Exploring Modern Practices
This guide will walk you through a project built with Java 21, Spring Boot 3, and Gradle. Our goal isn’t just to write working code - we want to make sure the project is robust, fast, and easy to maintain in the future.
We’ll start with basic setup, then explore database JPA, version control with Liquibase, and Redis caching. After that, we’ll focus on “observability” - learning how to monitor your app’s health using Micrometer and OpenTelemetry (OTLP), and send all monitoring data to Grafana for analysis.
This guide is perfect for developers who want to learn modern Spring Boot 3 practices.
🚀 Quick Start
Start the Application
1 | # Start with local development settings |
Verify Everything Works
1 | # Check application health |
Success response:
1 | { |
Failed response (duplicate book):
1 | { |
Error messages follow RFC 9457 format. See Spring Framework Reference for details.
View Swagger UI (API docs and test interface)
Open browser: http://localhost:8080/swagger-ui.html
View Grafana monitoring
Open browser: http://localhost:3000
📚 Suggested Learning Path (for beginners)
If you’re new to these technologies, follow this order:
Basic Features (1-2 days)
- Get the project running and test basic CRUD APIs
- Understand Spring Boot’s auto-configuration magic
- Get familiar with Swagger UI
Data Processing (2-3 days)
- Learn how JPA works with databases
- Understand how Liquibase manages database versions
- Implement MapStruct object mapping
Performance Optimization (1-2 days)
- Experience Redis caching benefits
- See virtual thread performance improvements
Monitoring & Observability (3-4 days)
- Learn to use Grafana to check system status
- Understand what @Observed annotation does
- Master distributed tracing concepts
Deployment Practice (2-3 days)
- Try different environment configurations
- Understand containerized deployment
💡 Tip: Don’t rush to learn everything at once. Get the basics working first, then gradually dive into advanced features. Hands-on practice at each stage gives the best learning experience!
Software Architecture
Here’s how the project works:
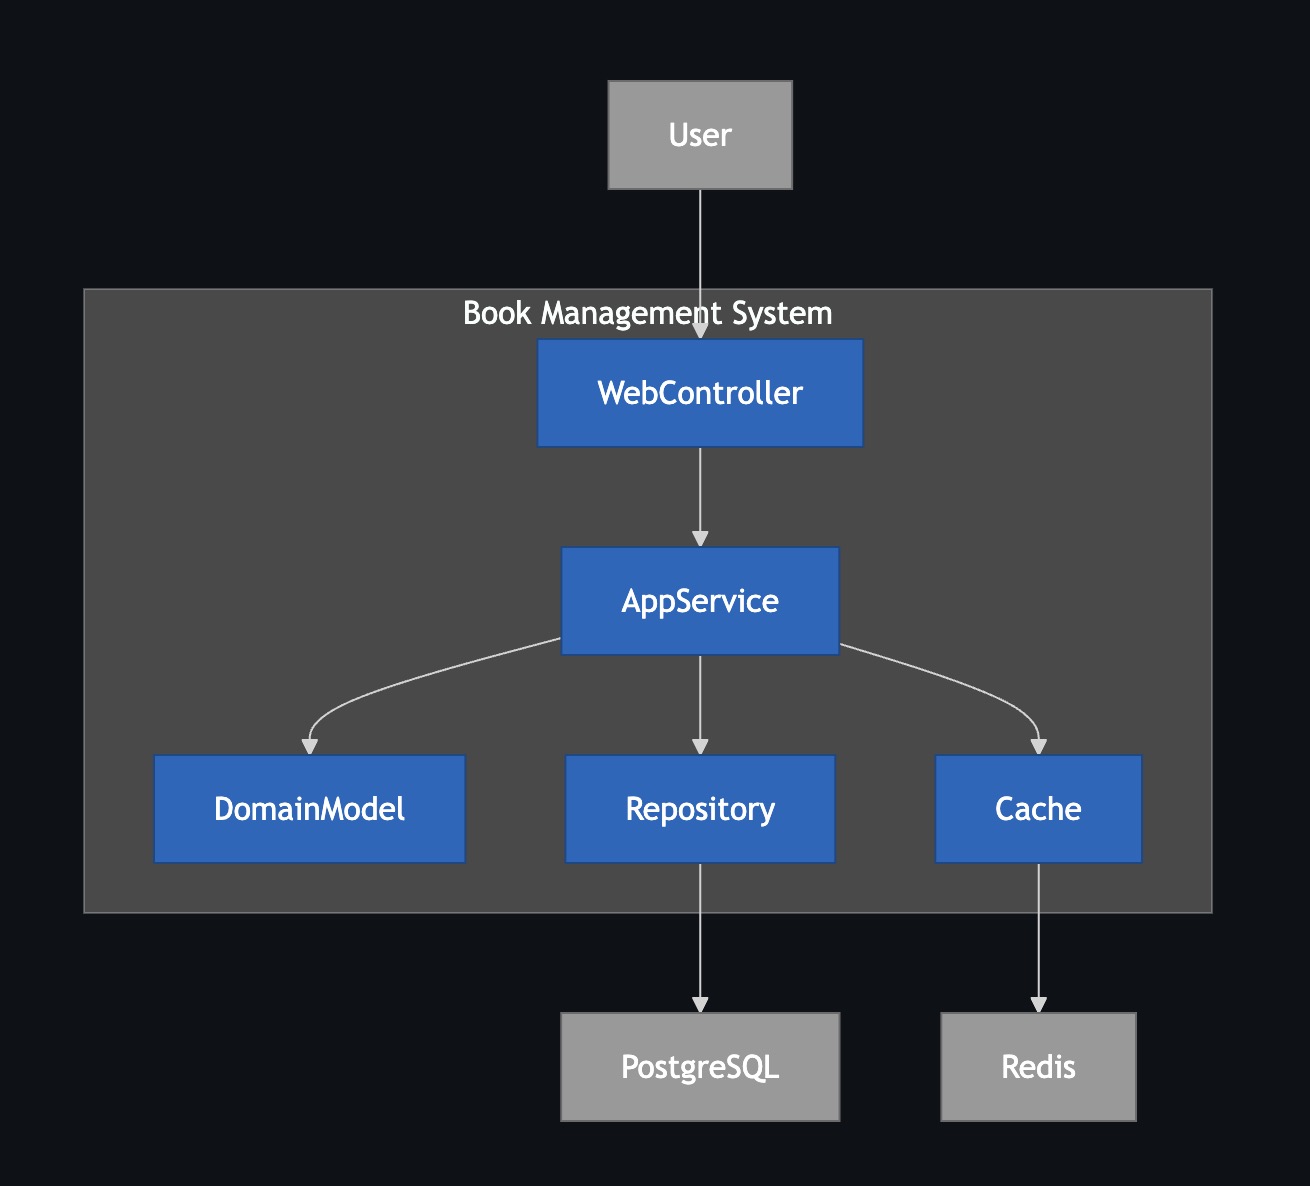
- WebController: Receives user actions, like button clicks
- AppService: Handles main business logic, the system’s core
- Repository / CacheService: Talks to database (PostgreSQL) and cache (Redis), handles data storage
- DomainModel: Defines system objects, like what properties a book should have
📁 Project Structure Overview
This project uses a common layered architecture. Different types of code go in different folders - like organizing clothes, pants, and socks separately. This makes finding and changing things much easier later.
1 | . |
🧩 Core Technologies & Key Dependencies
This project is built with a set of widely-used industry technologies.
Languages/Frameworks
- Java 21: Latest long-term support version with new features like virtual threads
- Spring Boot 3.5.x: Latest enterprise Java framework with built-in monitoring and auto-configuration
Build Tools & Plugins
These tools help us build and manage the project.
org.springframework.bootSpring Boot’s core tool. Makes it easy to start projects and package everything into a single runnable file.io.spring.dependency-managementSpring’s dependency management tool. It manages all package versions for us, so we don’t need to specify each version manually.org.openapi.generatorCore tool for “API First” approach. It readsopenapi.yamland automatically generates Java interfaces and data models (DTOs), keeping code and API docs always in sync.com.gorylenko.gradle-git-propertiesGenerates agit.propertiesfile with current Git version info (branch, commit). This way we always know which version is running in production.org.cyclonedx.bomSoftware Bill of Materials (SBOM) generator. It scans the project and lists all third-party packages used. Essential for checking known security vulnerabilities and license compliance.jacocoCode test coverage tool. Generates reports showing how complete our tests are.
Key Dependencies
These are the core packages needed at runtime.
API & Web Layer
spring-boot-starter-webEssential for building RESTful APIs. Includes embedded server (Tomcat) and Spring MVC framework.spring-boot-starter-validationData validation tool. Lets us use annotations like@NotNull,@Sizeon DTOs to set data rules. Spring automatically checks incoming data when APIs receive requests.springdoc-openapi-starter-webmvc-uiAutomatically generates interactive API documentation (Swagger UI). This webpage lets us test APIs directly in the browser based on our code and API specs.mapstructandmapstruct-processorObject mapping tool. Automatically generates code to convert between DTOs and database entities, avoiding lots of repetitive get/set code.jackson-databind-nullableHelper package for handling the difference betweennulland “not provided (undefined)” in JSON. Especially useful for partial updates (PATCH) - lets us tell if a user intentionally set a field tonullor just didn’t touch it.
Data Access & Cache Layer
spring-boot-starter-data-jpaSimplifies database operations. Makes CRUD (Create, Read, Update, Delete) operations easy.liquibase-coreDatabase version control tool. Lets us manage database structure changes with files, like using Git for code. Ensures consistent database structure across all development environments.spring-boot-starter-cacheProvides standard caching API. We can easily add caching with annotations like@Cacheablewithout worrying about the underlying cache technology.spring-boot-starter-data-redisRedis integration package. When used withspring-boot-starter-cache, Spring Boot automatically uses Redis as our cache storage.
Observability Layer
spring-boot-starter-actuatorFoundation of observability. Provides monitoring and management endpoints like/actuator/healthfor checking application health.spring-boot-starter-aopEnables@Observedannotation. Provides “Aspect-Oriented Programming” technology that lets monitoring tools automatically add metrics and tracing logic around our code.io.micrometer:micrometer-tracing-bridge-otelA bridge that translates Micrometer tracing commands into OpenTelemetry format.io.opentelemetry:opentelemetry-exporter-otlpAn exporter that packages traces and logs into OTLP format and sends them to backend monitoring systems.io.opentelemetry.instrumentation:opentelemetry-spring-boot-starterOpenTelemetry auto-configuration tool. Simplifies integration complexity and automatically integrates OTel features (like sending logs) into Spring Boot projects.io.micrometer:micrometer-registry-otlpMetrics exporter. Converts Micrometer-collected metrics to OTLP format and sends them out.io.micrometer:micrometer-registry-prometheusPrometheus metrics endpoint. Provides another way to view metrics at/actuator/prometheus, creating a page for Prometheus systems to read. Very useful for local development.
⚙️ Environment Configuration & Settings Management
Configuration File Loading Priority
Spring Boot loads configuration files in this priority:
application.yml- Base shared configurationapplication-{profile}.yml- Environment-specific configuration (overrides base config)
During development, Spring also reads files in the config/ folder, like application-local.yml designed for local development.
Configuration File Architecture
Our configuration files use a layered design to handle different environments and deployment platforms properly.
Base Configuration Files (src/main/resources/)
These files are packaged into the Docker image, containing shared settings for all environments or platform-specific optimizations.
| File | Purpose | Description |
|---|---|---|
application.yml |
Base shared settings | Basic configuration shared by all environments |
application-gcp.yml |
Google Cloud Platform | Enables GCP-specific service integrations |
application-aws.yml |
Amazon Web Services | Enables AWS-specific service integrations |
GCP Environment Example:
1 | # application-gcp.yml |
Environment-Specific Configuration (config/)
These files are NOT packaged into the Docker image - they must be mounted externally during deployment. This design follows the 12-Factor App Codebase principle, allowing the same code to run in different environments.
| File | Environment | Description | Key Features |
|---|---|---|---|
application-local.yml |
Local development | Developer machine settings | Detailed logs, SQL display, full monitoring |
application-sit.yml |
System integration test | SIT test environment | Full tracing, detailed logs, all endpoints open |
application-uat.yml |
User acceptance test | UAT test environment | Medium sampling, limited endpoints, near-production config |
application-prod-example.yml |
Production template | Production config reference | Low sampling, security config, performance optimization |
Multi-Environment Startup Examples
Local Development
1 | # Pure local environment |
Test Environments
1 | # SIT environment (local or standalone server) |
🎯 Configuration Best Practices
Dynamic Version Injection
We use @project.version@ to dynamically load the version from build.gradle:
1 | spring: |
This ensures:
- ✅ Version stays consistent with build.gradle
- ✅ Avoids manual version update errors
- ✅ Monitoring systems can correctly track service versions
Configuration Security Best Practices
🔐 Handling Sensitive Information
Never put sensitive info (passwords, API keys, tokens) directly in config files. Recommended approaches:
Environment Variables:
1
2
3spring:
datasource:
password: ${db.password}Cloud Secret Manager:
1
2
# GCP
db.password: ${sm@project_db_password}
📊 Environment-Specific Tuning
Different environments should have different performance settings:
1 | # application-local.yml (development) |
VSCode Development Setup
We recommend creating .vscode/launch.json to simplify development. This file lets you start and debug Spring Boot applications directly in VSCode without typing long commands in the terminal.
Create via VSCode Command Palette (Recommended)
- Open Command Palette: Use
Ctrl+Shift+P(Windows/Linux) orCmd+Shift+P(macOS) - Search Command: Type
Java: Run and Debugand select it - Select Main Class: VSCode will scan the project, choose
com.example.demo.DemoApplication - Auto-generate Config: This automatically creates
.vscode/launch.jsonin the project root
1 | { |
🛠️ Development & Setup
Development Guide
- When
openapi.yamlchanges, manually run./gradlew clean openApiGenerateto regenerate API code - Use
./gradlew bootRun --args='--spring.profiles.active=local'to start withlocalprofile - During local development, visit
http://localhost:8080/swagger-ui.htmlto view and test APIs
IDE Integration
For VSCode and other IDE development setup, see the detailed instructions in ⚙️ Environment Configuration & Settings Management section above.
🤝 API First Development Workflow
This project follows API First development - “define API specs first, then write code”.
We write all API details (like paths, parameters, response formats) in openapi.yaml. This file is our single, final standard - the “Single Source of Truth”. This ensures API documentation and actual code always stay in sync.
How It Works
We use the org.openapi.generator Gradle tool for automation. When you compile the project, it:
- Reads Spec: Reads the
dev-resources/openapi.yamlfile - Generates Code: Automatically generates corresponding Java interfaces and DTOs
- Includes in Build: Treats generated code as part of the source code
- Developer Implementation: Developers focus on business logic, implementing the generated interfaces
Key Settings in build.gradle
Let’s look at the openApiGenerate task configuration:
1 | tasks.named('openApiGenerate') { |
Important Parameters Explained:
interfaceOnly: "true"- Purpose: Only generates Java
interface, not actualControllerimplementation classes - Benefit: Gives developers flexibility to implement business logic freely
- Purpose: Only generates Java
useSpringBoot3: "true"- Purpose: Ensures generated code is compatible with Spring Boot 3
- Impact: Uses latest Jakarta EE specs instead of old
javax
useTags: "true"- Purpose: In
openapi.yaml, you can addtagsto APIs. This setting generates different API interface files based on tags - Benefit: Avoids cramming all APIs into one huge file, making code more maintainable
- Purpose: In
useResponseEntity: "true"- Purpose: Makes API methods return Spring’s
ResponseEntity<T> - Benefit: Gives precise control over HTTP response codes (like 200, 201, 404) and headers
- Purpose: Makes API methods return Spring’s
unhandledException: "true"- Purpose: Adds
throws Exceptionto generated interface methods - Goal: Forces developers to think about and handle possible errors
- Purpose: Adds
hateoas: "false"- Purpose: Disables HATEOAS functionality (a style where API responses include related operation links, usually not needed for regular REST APIs)
The interfaceOnly: "true" setting is key - it generates only API “specifications” and data models, while Controller “implementations” are done by developers. This cleanly separates “API definition” from “business logic implementation”.
Benefits of API First
- Contract as Documentation:
openapi.yamlitself is the most accurate, up-to-date API documentation - Enforced Consistency: Since our
BookControllermust implement theBooksApiinterface, any spec-breaking changes fail at compile time - Parallel Development: While backend developers build API features, frontend developers or other teams can use
openapi.yamlto generate client stubs or mock servers for development and testing
🗺️ Object Mapping (MapStruct)
We use these two packages:
org.mapstruct:mapstructorg.mapstruct:mapstruct-processor
Purpose
In layered architecture, we don’t want to pass database entities directly to frontend or external users. Instead, we create special Data Transfer Objects (DTOs).
MapStruct is a tool for “object conversion”. It automatically generates code to convert between Entities and DTOs.
Benefits
- Great Performance: It generates actual Java conversion code at compile time without reflection, so it’s very fast
- Type Safety: If field names or types don’t match during conversion, compilation fails, catching errors early
- Less Boilerplate: Developers just define a conversion interface, MapStruct generates all the get/set mapping code automatically
Key Settings in build.gradle
1 | tasks.withType(JavaCompile) { |
Mapper Interface Definition (BookMapper.java)
We define a BookMapper interface with @Mapper annotation to tell MapStruct it’s a converter. With componentModel = "spring", the generated BookMapperImpl class automatically gets @Component annotation, making it injectable as a Spring Bean.
1 |
|
Usage Example
1 |
|
📜 Database Version Control (Liquibase)
In team development, managing database schema changes is a big challenge. If everyone randomly modifies their local database or relies on JPA’s ddl-auto: update, it’s easy to end up with different database structures, causing weird errors.
This project uses Liquibase to manage database structure changes like code. This ensures consistent and trackable database structures from development to testing to production.
Why Not Use ddl-auto?
While spring.jpa.hibernate.ddl-auto = update is convenient in early development, it has serious problems:
- No Precise Control: You can’t control exactly what SQL commands it generates
- Possible Data Loss: In some cases, it might misjudge and delete columns or tables
- No Version History: You have no idea when, who, or what changed the database
- Not for Production: Never use
updatein production environments
Liquibase solves these problems with a more rigorous process.
How Liquibase Works
- Automatic Execution: When Spring Boot starts, it detects Liquibase and automatically runs database updates
- Changelog: Developers write all database modifications (like creating tables, adding columns) in “changelog” files. We use YAML format here
- Tracking Tables: Liquibase creates two management tables in your database:
DATABASECHANGELOGandDATABASECHANGELOGLOCKDATABASECHANGELOGLOCK: A lock ensuring only one application instance executes database changes at a time, avoiding conflictsDATABASECHANGELOG: A record table. Every successfully executed change is recorded here. Each time the app starts, Liquibase compares the changelog file with this table, executing only new changes not yet recorded
Project Implementation
Master Changelog
This is Liquibase’s entry file at src/main/resources/db/changelog/db.changelog-master.yaml. It doesn’t contain actual SQL changes but acts like a table of contents, referencing other change files.
1 | # db.changelog-master.yaml |
Changeset Files
All actual database structure changes are defined in these files. We put them in the history/ folder, named by date for easy tracking. One file can contain multiple changeSets. Each changeSet is an independent, immutable database operation unit, uniquely identified by id and author.
Example history/20250614.yaml:
1 | # history/20250614.yaml |
Development Workflow: How to Add a Database Change
Let’s say you need to add a stock_quantity column to the book table.
Create New File: Create a new YAML file in
src/main/resources/db/changelog/history/, like20250616-add-stock-to-book.yamlDefine ChangeSet: Write your change in the new file. Remember
idmust be uniqueUpdate Master File: Go back to
db.changelog-master.yamlandincludethe new file1
2
3
4
5
6
7
8
9databaseChangeLog:
- include:
file: history/20250614.yaml
relativeToChangelogFile: true
description: Initialize tables
- include: # ✨ Add this section
file: history/20250616-add-stock-to-book.yaml
relativeToChangelogFile: true
description: Add stock column to bookStart Application: Restart Spring Boot. Liquibase checks the
DATABASECHANGELOGtable, finds this newchangeSethasn’t been executed, and runs the correspondingALTER TABLESQL command to add the new column
This process ensures every database change is recorded, trackable, and automatically applied consistently across all team members and environments.
⚡️ Caching Mechanism (Spring Cache + Redis)
To speed up application response times and reduce database load, we’ve implemented caching. For data that doesn’t change often but is read frequently, caching can dramatically improve performance.
This project uses Spring Cache as the unified caching standard with Redis as the actual cache implementation.
Spring Cache: Consistent Cache Abstraction
spring-boot-starter-cache provides a standard caching API. Its biggest benefit is letting our business logic code not worry about the underlying cache technology. Developers just need to learn a few standard annotations to add caching functionality.
@EnableCaching: Used on configuration classes, the master switch to enable Spring Cache@Cacheable: Used on data reading methods. When this method is called, Spring first checks the cache. If data exists, it returns directly from cache without executing the method. If not, it executes the method, stores the result in cache, then returns it@CacheEvict: Used on data modification or deletion methods. When data changes, this annotation clears old data from cache to avoid users seeing stale content
Redis: High-Performance Cache Implementation
We chose Redis as our cache server. Thanks to Spring Boot’s powerful auto-configuration, integrating Redis is very simple:
- Add
spring-boot-starter-data-redisdependency inbuild.gradle - Configure Redis connection in
application.yml
With just these two steps, Spring Boot automatically sets Redis as our default cache implementation.
Cache Implementation
Let’s look at the cache design in BookService.
Strategy: Only Cache High-Frequency Single Item Reads
In our project, we use a more precise caching strategy. We found that “get all books” (getAllBooks()) might return lots of data, and if any book changes, the entire list cache becomes invalid - not very efficient.
Therefore, our strategy is: Only cache getBookById(id) - single item reads with high usage frequency.
1. Enable Caching
We enable caching in CacheConfig.java and define cache space names.
1 | // src/main/java/com/example/demo/config/CacheConfig.java |
2. Cache Single Book Reads
We only add @Cacheable annotation to the getBookById method. Note the key syntax - we use a little trick to create more meaningful keys.
1 | // src/main/java/com/example/demo/applications/BookService.java |
key = "'book_' + #id": This is a good practice. It adds a book_ prefix to all book-related cache keys. When id is 123, the Redis key becomes book_123 instead of just 123. This greatly improves readability and avoids confusion with other numeric ID caches (like user_123).
3. Precise Single Cache Eviction
Since we don’t cache the entire book list, when updating or deleting a book, we don’t need to clear all book caches. We only need to precisely clear the cache for that specific modified or deleted book.
1 | // src/main/java/com/example/demo/applications/BookService.java |
createBook (add new book) method now doesn’t need any @CacheEvict annotation. Adding a new book doesn’t make any existing cached data “old” or “wrong”.
4. Critical Setting: Making #id Expression Work
When we use SpEL expressions like key = "#id" in @Cacheable or @CacheEvict, we’re telling Spring: “Please use this method’s id parameter as the cache key”.
But how does Spring know which parameter is called id? By default, the Java compiler doesn’t preserve method parameter names (like id, book) in compiled .class files to save space. This causes Spring Cache to fail when parsing #id, throwing errors.
To fix this, we must explicitly tell the compiler to preserve parameter names. Just add one setting in build.gradle:
1 | // build.gradle |
With the -parameters compiler flag, Spring Cache gets enough information to correctly parse #id as the id parameter value in getBookById(Integer id) method, making our dynamic cache keys work properly. This setting is shared by all tools in the project that depend on parameter names (including MapStruct).
Strategy Advantages
This “cache single items only” strategy is simpler and more efficient:
- Simple Logic: No more worrying about when to clear list caches
- Performance Boost: Directly helps the most common “get details by ID” scenario
- Minimal Write Impact: Updates or deletes have minimal cache impact, only affecting one key without touching other valid cached data
🚀 Performance Boost: Java 21 Virtual Threads
This project enables a heavyweight new Java 21 feature: Virtual Threads.
Traditional Thread Problems
In traditional Java applications, each Thread maps to an operating system thread. For network services that need lots of waiting (like waiting for database responses, external API responses), this wastes resources. When a thread is waiting, it’s not doing work but still occupying a precious system thread slot, limiting the number of concurrent requests the system can handle.
Virtual Thread Advantages
Virtual threads are ultra-lightweight threads managed by the JVM itself. Thousands of virtual threads can run on just a few traditional system threads. When a virtual thread needs to wait for I/O:
- It doesn’t block the underlying system thread
- The JVM “pauses” it and lets that system thread run another virtual thread’s task
- When the I/O operation completes, the JVM “wakes up” the original virtual thread to continue
This mechanism can greatly increase application throughput, letting us handle more concurrent requests with less hardware.
How to Enable?
In Spring Boot 3.2+, enabling virtual threads is very simple - just add one line to application.yml:
1 | spring: |
This tells Spring Boot to use virtual threads to handle all incoming HTTP requests.
🔬 Modern Observability - Part 1: Spring’s Implementation
“Observability” solves a core problem: when our application is running in production, how can we know what’s happening inside? This helps us quickly find problems and optimize performance. This system is usually built on three pillars: Metrics, Traces, and Logs.
These are the “Three Pillars of Observability”:
📊 Metrics: Numerical values aggregated over time
- How many people access my API per second?
- What’s the average response time?
- How high is the error rate?
🔍 Traces: The complete journey of a request from entering the system, through different services, to returning results
- What steps did an API request go through?
- How long did each step take?
- Which step was slowest?
📝 Logs: Records of individual events in the system
- What happened at a specific time?
- What’s the detailed error message?
- What did the user do?
Spring’s Modern Observability Philosophy
Before writing any monitoring code, we need to understand Spring Boot 3’s observability philosophy. Micrometer’s core developer Jonatan Ivanov said:
“In these apps I don’t create any Observations manually because basically everything that I would need is automatically instrumented…”
This reveals a core idea: Rely on Automatic Instrumentation First.
When we add spring-boot-starter-actuator and related packages to our project, the Spring Boot ecosystem automatically monitors lots of common operations for us, including:
- Incoming HTTP requests
- Outgoing RestTemplate requests
- Database JDBC queries
- Redis operations
- …and more
This means without doing anything, we can see these infrastructure-level metrics and traces in the monitoring backend.
So when do we need to do it ourselves?
Answer: When automatic instrumentation can’t reach our custom core business logic that we want to observe deeply.
For example, in our BookService, the createBook method includes multiple steps like “check ISBN, set timestamps, save to database”. We want to monitor the entire createBook operation as a meaningful business unit. This is where the @Observed annotation comes in.
@Observed: The Tool for Observing Core Business Logic
Micrometer is Spring’s official observability facade, providing a standard API that lets our code focus on “what to observe” without worrying about technical details.
The @Observed annotation is the best practice for adding observability to our custom business logic. As Jonatan Ivanov said:
“The idea… was that we want the users to instrument their code once using a single API and have multiple benefits out of it (e.g. metrics, tracing, logging).”
This is the core principle of @Observed: “Instrument once, multiple benefits”.
Why Not Use SDK or Java Agent Directly?
- Compared to using OpenTelemetry SDK directly: Using SDK directly requires lots of manual code to start/end traces, set attributes, etc. - tedious and error-prone.
@Observedhandles all this with a simple annotation. - Compared to using OpenTelemetry Java Agent: Agent is effective for automatically monitoring known third-party packages (like database drivers), but it doesn’t understand the business meaning of your custom methods (like
createBook).@Observedlets you give this operation a meaningful name, making monitoring charts easier to understand.
@Observed strikes a great balance between “simple convenience” and “powerful functionality”. It’s more concise than direct SDK use, yet more flexible than Java Agent for monitoring custom business logic.
@Observed Setup and Practice Guide
In Spring Boot 3, setting up @Observed is already very simple.
Step 1: Add Core Dependencies
In build.gradle, ensure these two key dependencies:
1 | // build.gradle |
Step 2: Enable Global Switch
In application.yml, turn on annotation-based observability:
1 | # src/main/resources/application.yml |
Step 3: Configure Async Tracing (if your project uses it)
Since Spring Boot 3.2, the core component ObservedAspect needed by @Observed is auto-configured - you don’t need to declare it manually.
Now, only when your project uses asynchronous operations like @Async, to ensure tracing information (like traceId) propagates correctly between threads, you need to create this configuration:
1 | // src/main/java/com/example/demo/config/ObservabilityConfig.java |
Note: If your project doesn’t use @Async at all, you don’t even need to create the ObservabilityConfig.java file.
Step 4: Apply Annotation in Business Logic
In BookService, we use advanced @Observed features to add meaningful business names and custom tags to monitoring.
1 | // src/main/java/com/example/demo/applications/BookService.java |
@Observed annotation parameters explained:
name: Metric name (book.details.view). We use “domain.subdomain.action” naming style for easier categorization and filtering in monitoring systems.contextualName: Trace Span name (View Book Details). We use plain business terms so even non-engineers can understand what each step means in trace charts.lowCardinalityKeyValues: Very useful feature. It lets us add custom Key-Value tags to metrics and traces.- What is Low Cardinality? “Cardinality” refers to the number of different possible values a tag can have. “Low cardinality” means the values are limited and predictable (e.g.,
operationcan only becreate,update,delete). We should only put low cardinality tags here. - Never put high cardinality values (like
book_id,user_id) here - this causes monitoring system index explosion and performance problems. - How to use: Provide in
{ "key1", "value1", "key2", "value2" }format.
- What is Low Cardinality? “Cardinality” refers to the number of different possible values a tag can have. “Low cardinality” means the values are limited and predictable (e.g.,
Advanced Tracing: Using Baggage to Inject High Cardinality Business Context (Optional)
We mentioned that lowCardinalityKeyValues should not store high cardinality data like book_id or user_id. So the question is: if I need to trace the complete request chain for a specific book_id, how do I do it?
The answer is using Baggage.
Baggage is a powerful concept in OpenTelemetry. Think of it as a “carry-on luggage” that travels with requests through the system. You can put a business ID (like book-id: 123) into this luggage at the request entry point (e.g., Controller), and this ID will automatically propagate through the entire call chain, even across multiple microservices.
This is an optional but extremely useful technique that can improve debugging and troubleshooting efficiency by an order of magnitude.
Step 1: Configure Baggage Fields in application.yml
First, we need to explicitly tell Micrometer Tracing which Baggage fields we want to track.
1 | # src/main/resources/application.yml |
Step 2: Set Baggage Value in Controller
After configuration, we need to inject Tracer at the program entry point (BookController) and put the incoming id into Baggage.
1 | // src/main/java/com/example/demo/interfaces/rest/BookController.java |
Step 3: Verify Results in Grafana Tempo
After completing setup and sending a request (e.g., GET /books/2), we can see amazing results in Grafana Tempo. In the trace waterfall chart, click on any Span, and you’ll clearly see the book-id tag we just set in the Span Attributes section below.
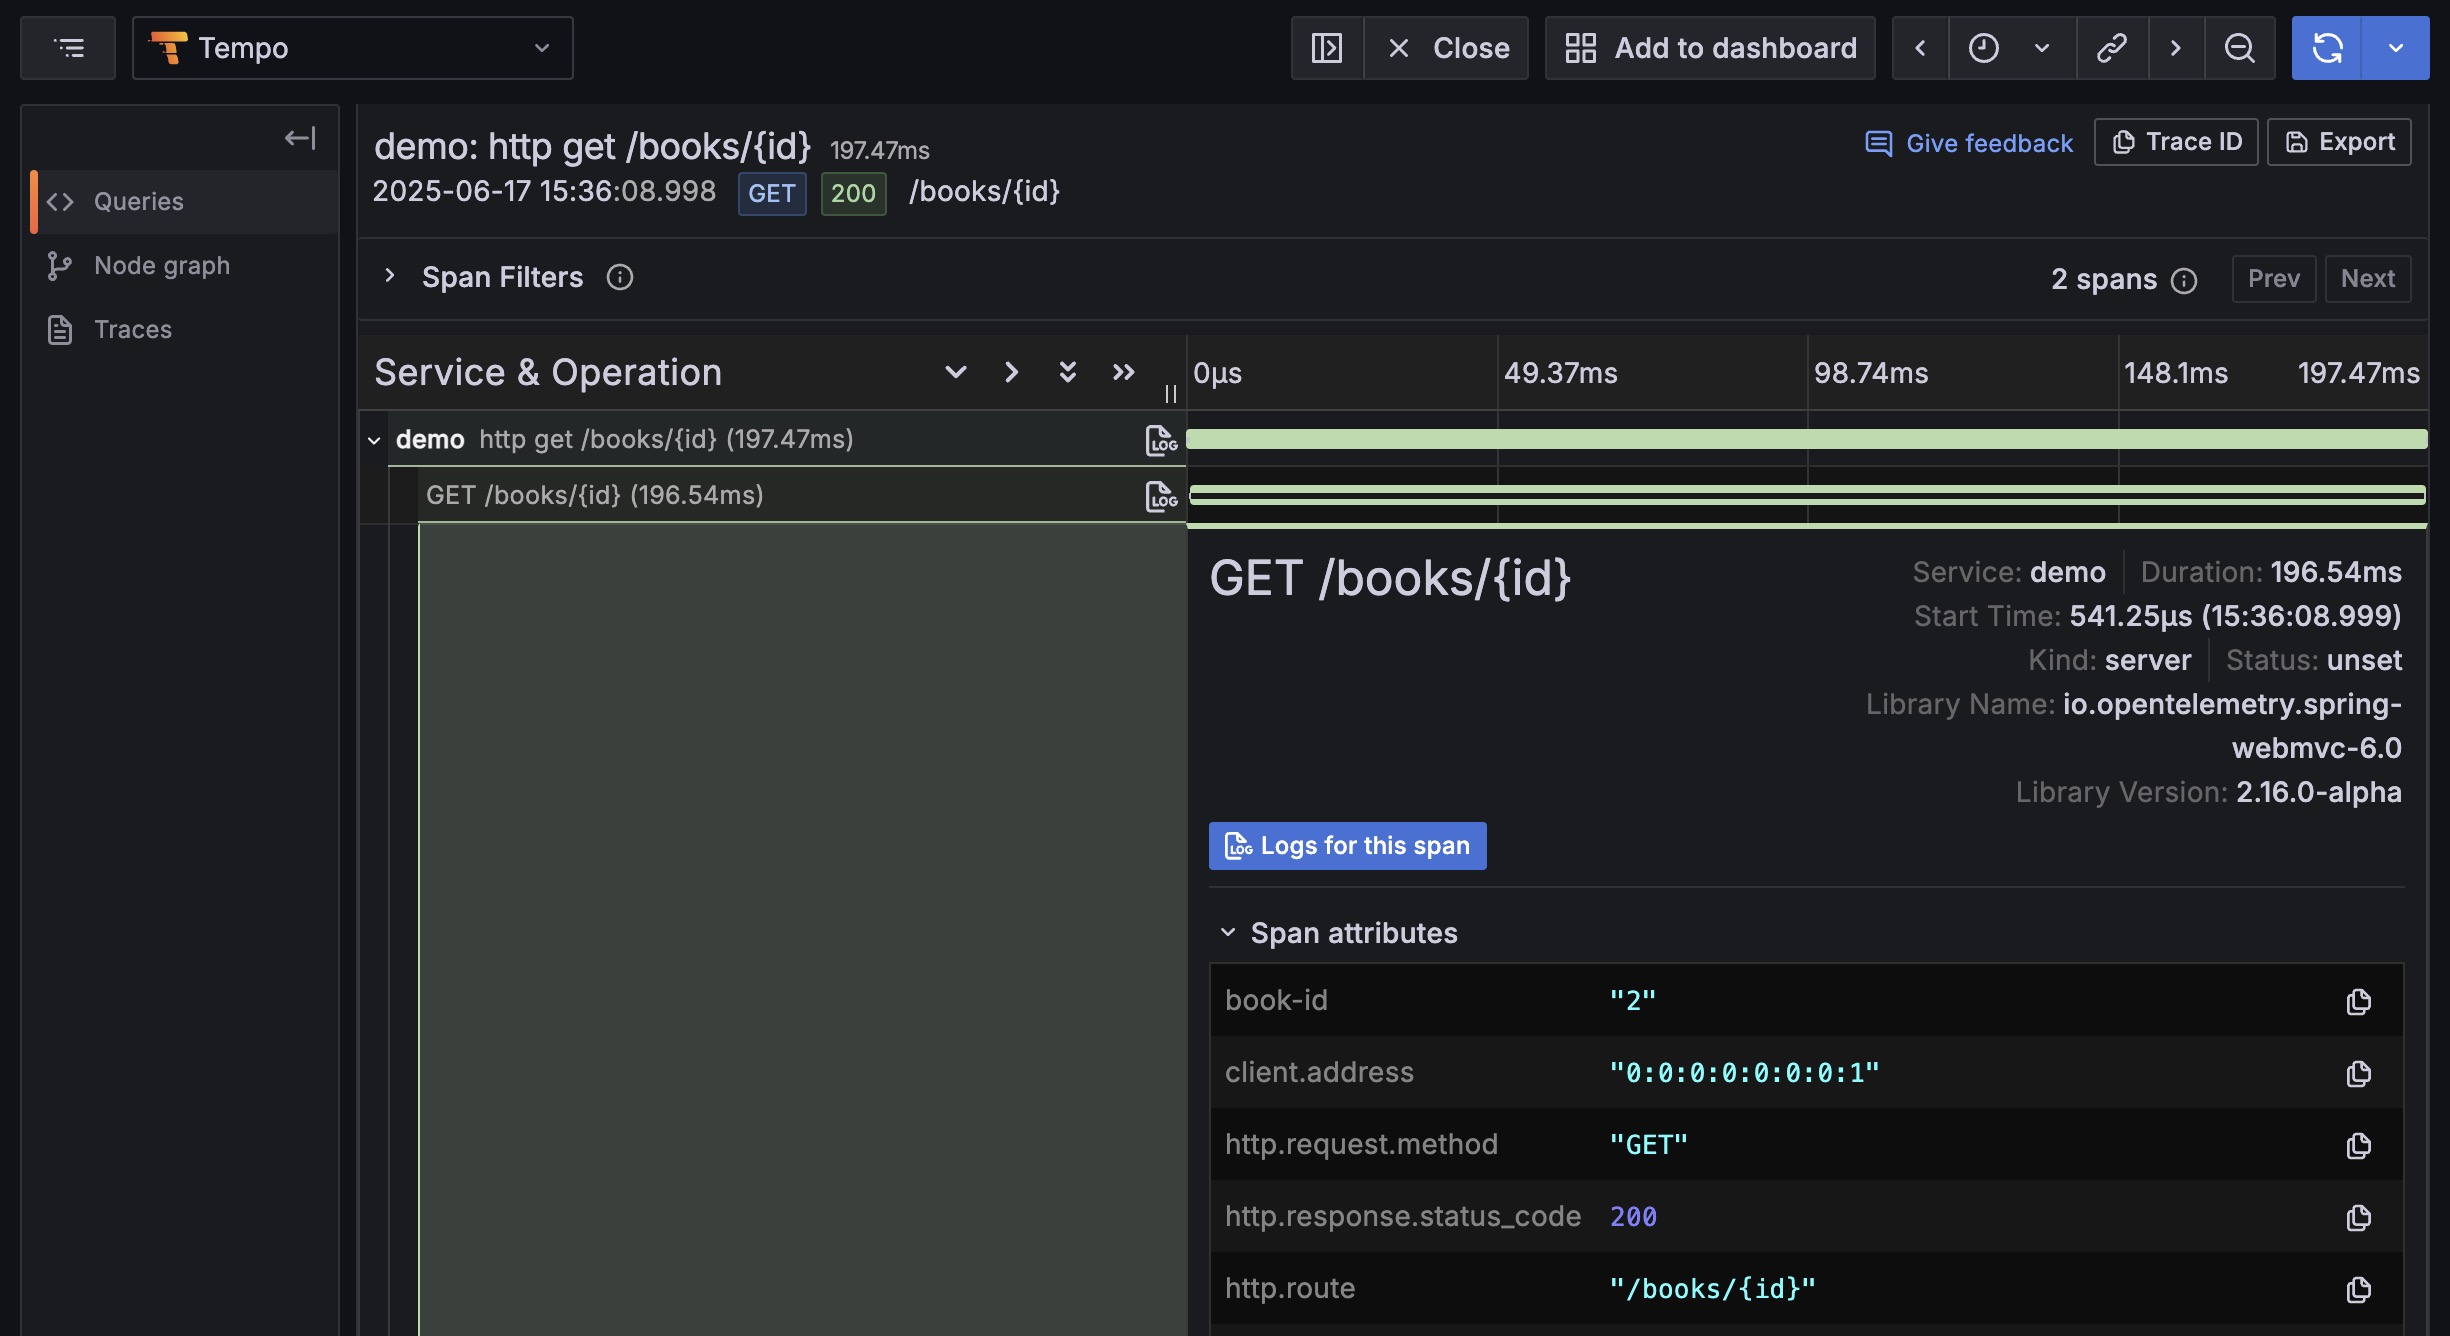
With this feature, when customer service reports “Book page with ID 2 loads slowly”, operations staff no longer need to search blindly. They can directly query in Tempo using something like { resource.service.name="demo", book-id="2" } to immediately filter all request chains related to this book, precisely locating the problem source.
From Technical Monitoring to Business Insights
Through this business-semantic monitoring approach, our monitoring data is no longer just cold technical metrics but can provide valuable business insights.
For example, we can now directly answer these questions in monitoring systems like Grafana:
- Analyze Customer Behavior:
-getAllBooksmarked asbook.catalog.browse, we can count “How often do customers browse the product catalog?”
-getBookByIdmarked asbook.details.view, we can analyze “How many book details do customers view on average?” - Evaluate Inventory Management Efficiency:
- By filteringoperationtags (create,update,remove), we can create dashboards showing “Daily new books”, “Update frequency”, and “Product removals”. - Quantify Business Impact:
- We definedbusiness_impacttags for different operations (likehigh,medium). Now we can set smarter alerts, e.g., “Only send urgent alerts when operations withbusiness_impactofhigh(like removing products) have error rates over 1%”, letting teams focus on truly important issues.
In summary, this use of @Observed makes monitoring data valuable for the entire team (including product, operations, and management).
🔬 Modern Observability - Part 2: Working with OpenTelemetry
We’ve learned to use @Observed to add observability to business logic. Now let’s unveil the mystery and see how these technology packages work together to convert monitoring data to OpenTelemetry format and send it out.
Overall Architecture Diagram
1 | graph TD |
Layered Architecture: Decoupling and Collaboration
To understand these package relationships, the key is grasping Spring Boot 3’s observability layered architecture:
- Instrumentation Layer: Where we developers interact, mainly using
@Observed - Facade Layer: Provided by Micrometer. It defines a neutral, standard API
- Implementation Layer: Handled by OpenTelemetry. It’s the actual engine behind Micrometer API
- Export Layer: Composed of various Exporters, responsible for packaging monitoring data into OTLP format and sending to backend systems
Key Package Responsibilities and Data Flow
The diagram below clearly shows how metrics, traces, and logs are processed through different paths when a method with @Observed is called.
1 | graph TD |
| Package (Dependency) | Purpose | Description |
|---|---|---|
spring-boot-starter-actuator |
Framework Foundation | Cornerstone of observability. It brings in Micrometer and provides /actuator endpoints. |
spring-boot-starter-aop |
Powers @Observed |
Provides AOP technology that lets @Observed annotation be intercepted and automatically add monitoring logic. |
io.micrometer:micrometer-tracing-bridge-otel |
API Bridge | Acts as translator, converting Micrometer tracing commands into OpenTelemetry-understandable commands. |
io.opentelemetry.instrumentation:opentelemetry-spring-boot-starter |
Auto-configuration Package | Greatly simplifies integration, automatically completes OpenTelemetry initialization and setup behind the scenes. |
io.opentelemetry:opentelemetry-exporter-otlp |
Trace & Log Exporter | Responsible for packaging generated traces and logs into OTLP format and sending over network. |
micrometer-registry-otlp |
Metrics Exporter | Clear responsibility: converts Micrometer-collected metrics to OTLP format and pushes to backend. |
micrometer-registry-prometheus |
Metrics Local Endpoint | Provides another way to view metrics. It opens an HTTP endpoint at /actuator/prometheus, convenient for direct metric viewing during development and debugging. |
Simply put, our application monitors through unified Micrometer API (@Observed), implemented by OpenTelemetry behind the scenes, with specialized exporters sending data in OTLP format to the backend. All this complex assembly work is automated by Spring Boot, creating a clear, maintainable observability system.
Runtime View
Journey of an API Request
Let’s see what happens internally when an “add book” request (POST /books) comes in.
1 | sequenceDiagram |
🔬 Modern Observability - Part 3: Exploring Telemetry Data in Grafana
Now comes the most exciting part: actually seeing the telemetry data we’ve worked hard to collect. Open your browser and visit http://localhost:3000 to enter Grafana’s dashboard.
Grafana Navigation and Data Sources
In Grafana’s left navigation bar, click “Explore” (compass icon). In the dropdown menu at the top of the page, you’ll see that the otel-lgtm Docker image has pre-configured three core data sources for us, corresponding to the three pillars of observability:
mimir: For querying Metricsloki: For querying Logstempo: For querying Traces
The Art of Tracing: Using Tempo and TraceQL
On Grafana’s Explore page, select the tempo data source. We can use TraceQL language to query traces.
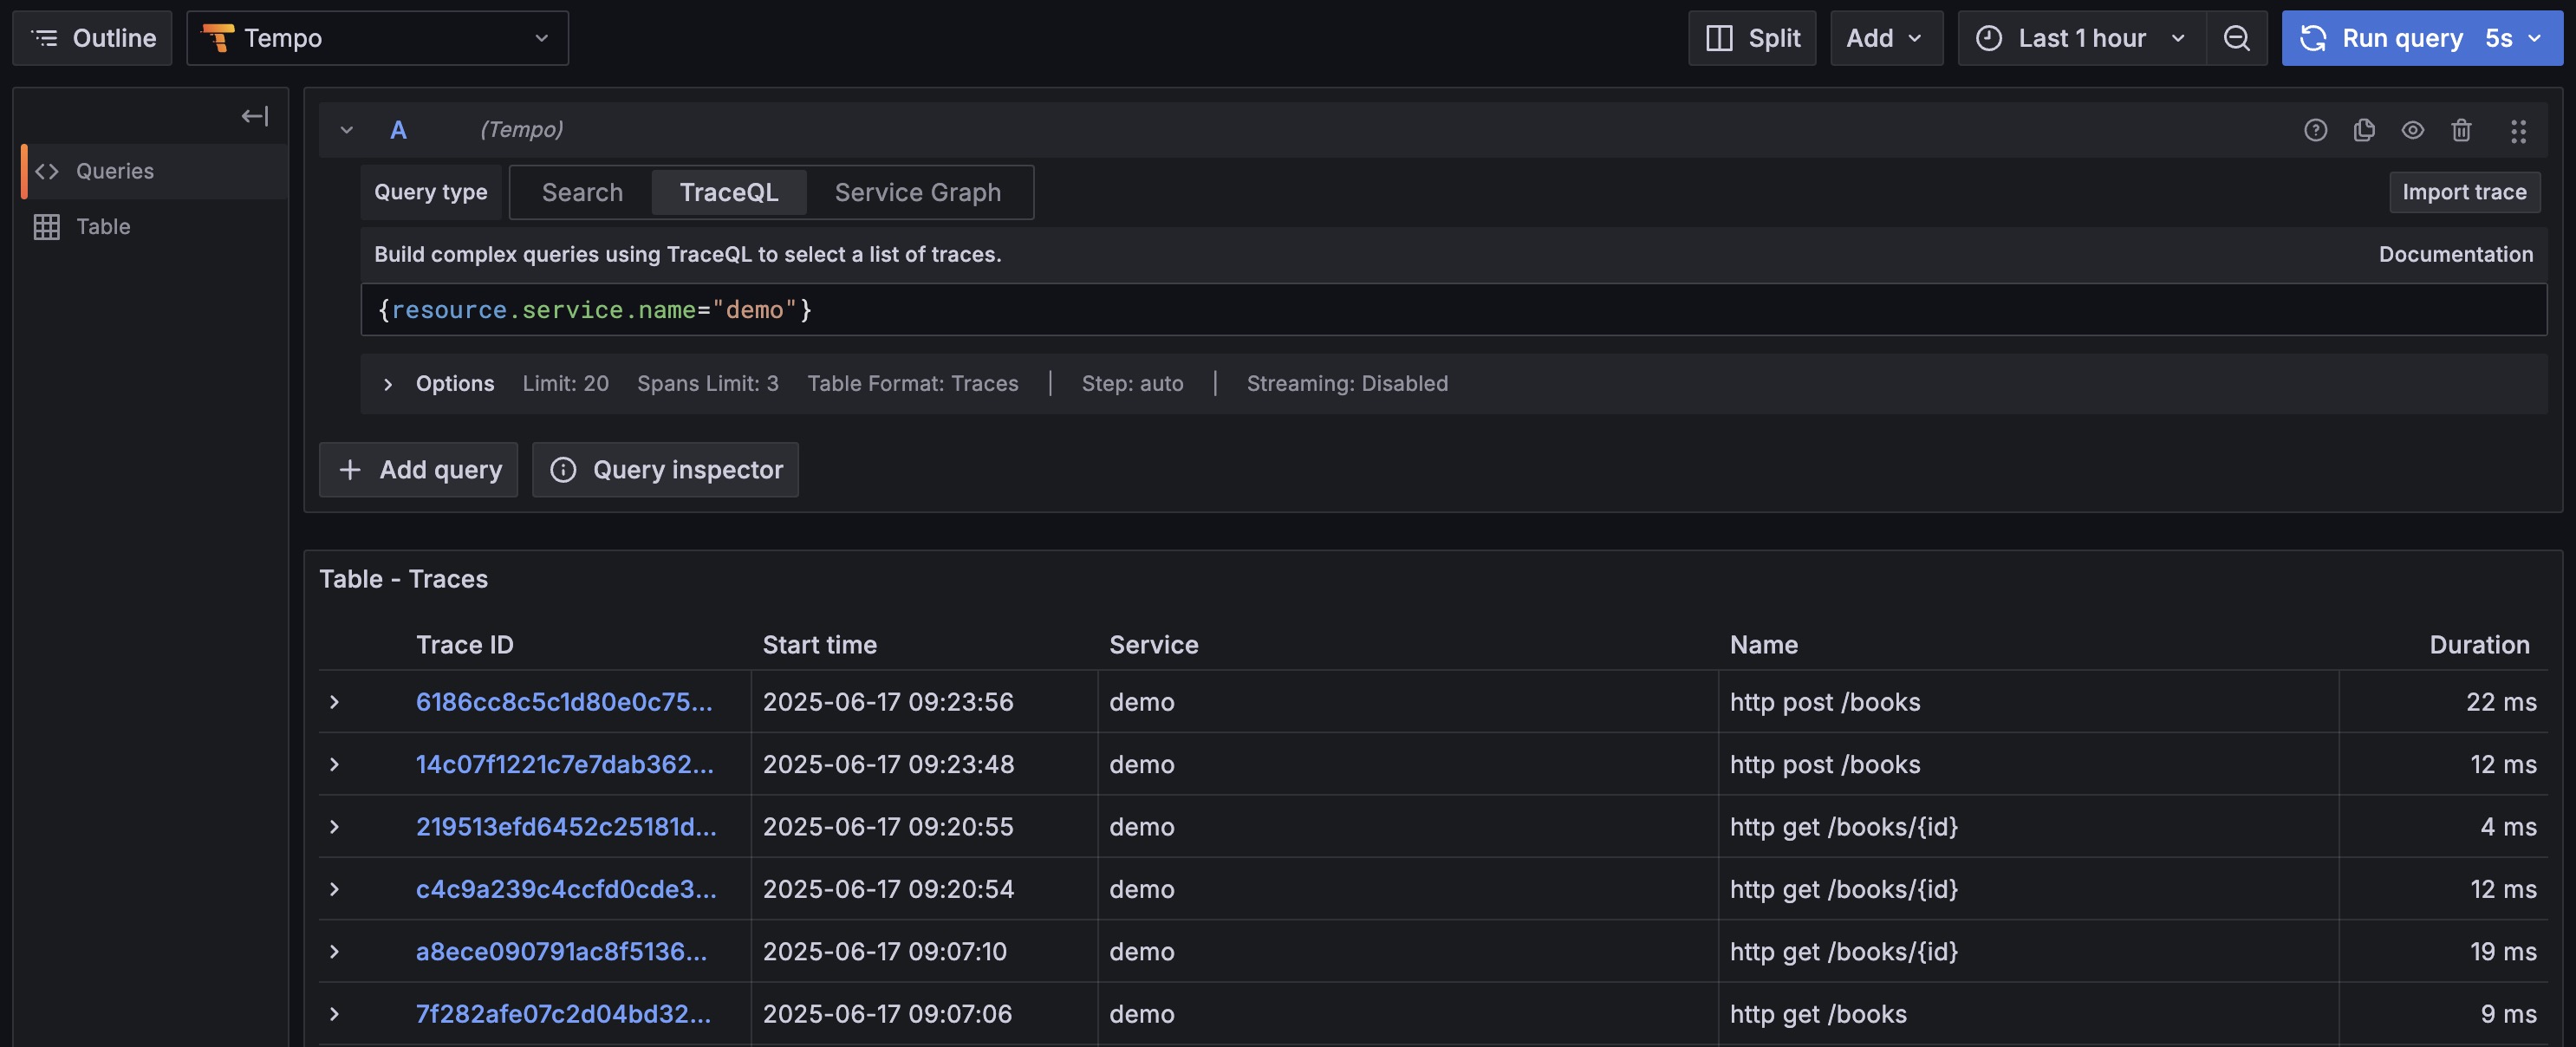
Query by Service Name:
Inapplication.yml, we definedspring.application.name: demo. This name becomesservice.namein OpenTelemetry. Therefore, the most common query is filtering all traces from our application.1
{resource.service.name="demo"}
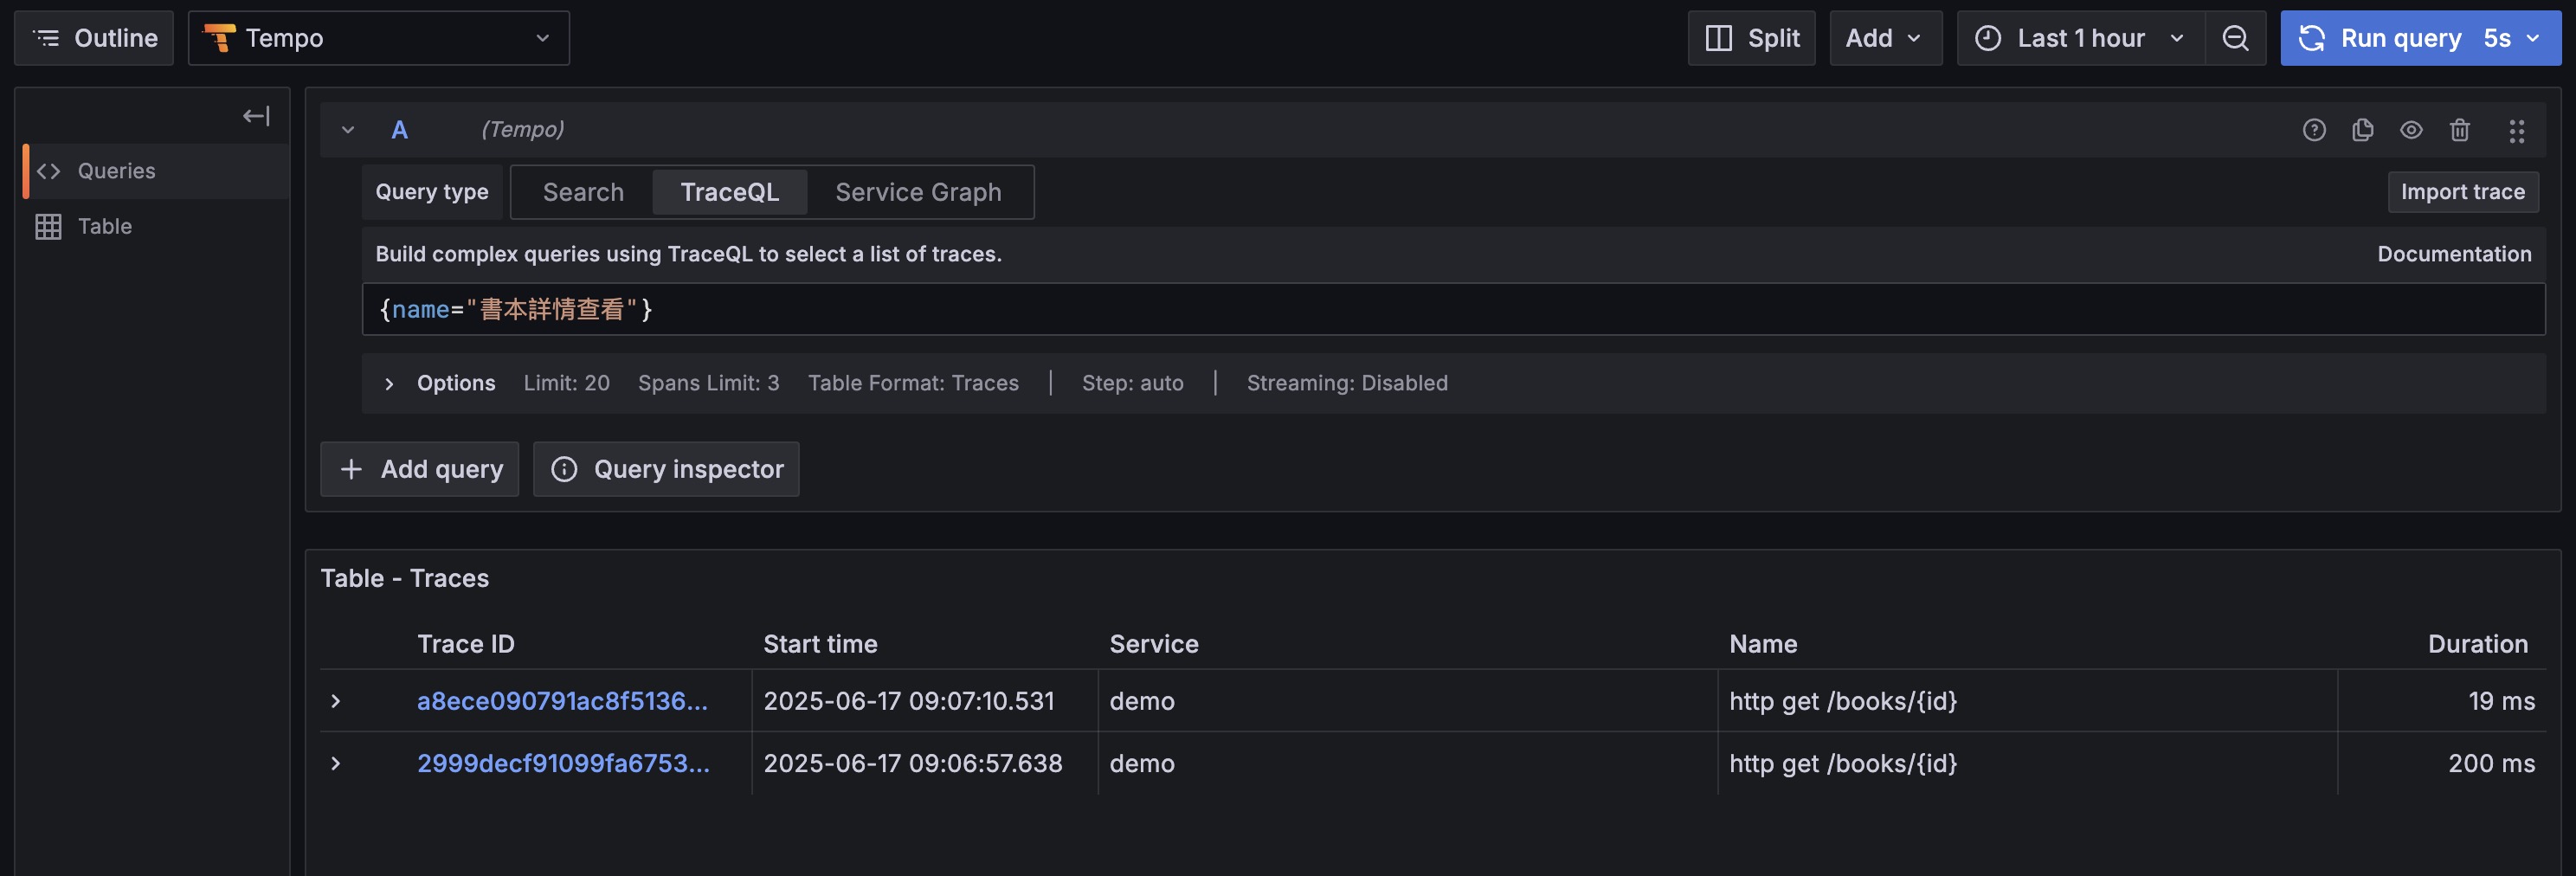
Query by Custom Span Name:
We used@Observed(contextualName = "View Book Details")inBookServiceto give methods meaningful names. This name becomes the Span name, letting us precisely find traces of specific business logic.1
{name="View Book Details"}
Analyze Trace View (Waterfall View):
Click any query result to see a waterfall chart.- Cache Miss: When you first query a book’s details, you’ll see a hierarchical structure: top level is
GET /books/{id}, below isView Book Details, and further below areSELECTdatabase query Spans. Each Span’s duration is clearly visible. - Cache Hit: When you query the same book again, the
SELECTSpan disappears and total trace duration significantly shortens. This directly proves cache effectiveness.
- Cache Miss: When you first query a book’s details, you’ll see a hierarchical structure: top level is
The Power of Metrics: Using Mimir and PromQL
In the new version, although the underlying metric storage technology is Mimir, it provides a fully Prometheus-compatible query endpoint. Therefore, the data source is directly named prometheus, letting users focus on using standard PromQL (Prometheus Query Language) for queries - the most widely used metric query language in the industry.
OTLP to Prometheus Name Conversion
Understanding a key conversion rule is crucial: Micrometer-generated metric names are converted when exported to Mimir/Prometheus via OTLP.
- Dots
.in metric names are converted to underscores_ - The
service.name(demo) resource attribute is mapped to thejoblabel - Timers (
@Observedor HTTP requests) automatically generate metrics in_millisecondsunits with suffixes like_count,_sum,_bucket(histogram buckets). This is because newer Micrometer versions default to milliseconds for higher precision.
Original Name (@Observed name) |
Converted PromQL Metric (example) |
|---|---|
book.details.view |
book_details_view_milliseconds_count, book_details_view_milliseconds_sum |
| HTTP Server Requests | http_server_requests_milliseconds_count |
Useful PromQL Queries
Query API Requests Per Second (RPS):
1
rate(http_server_requests_milliseconds_count{job="demo"}[5m])
This query calculates the average requests per second for the
demoservice over the past 5-minute window.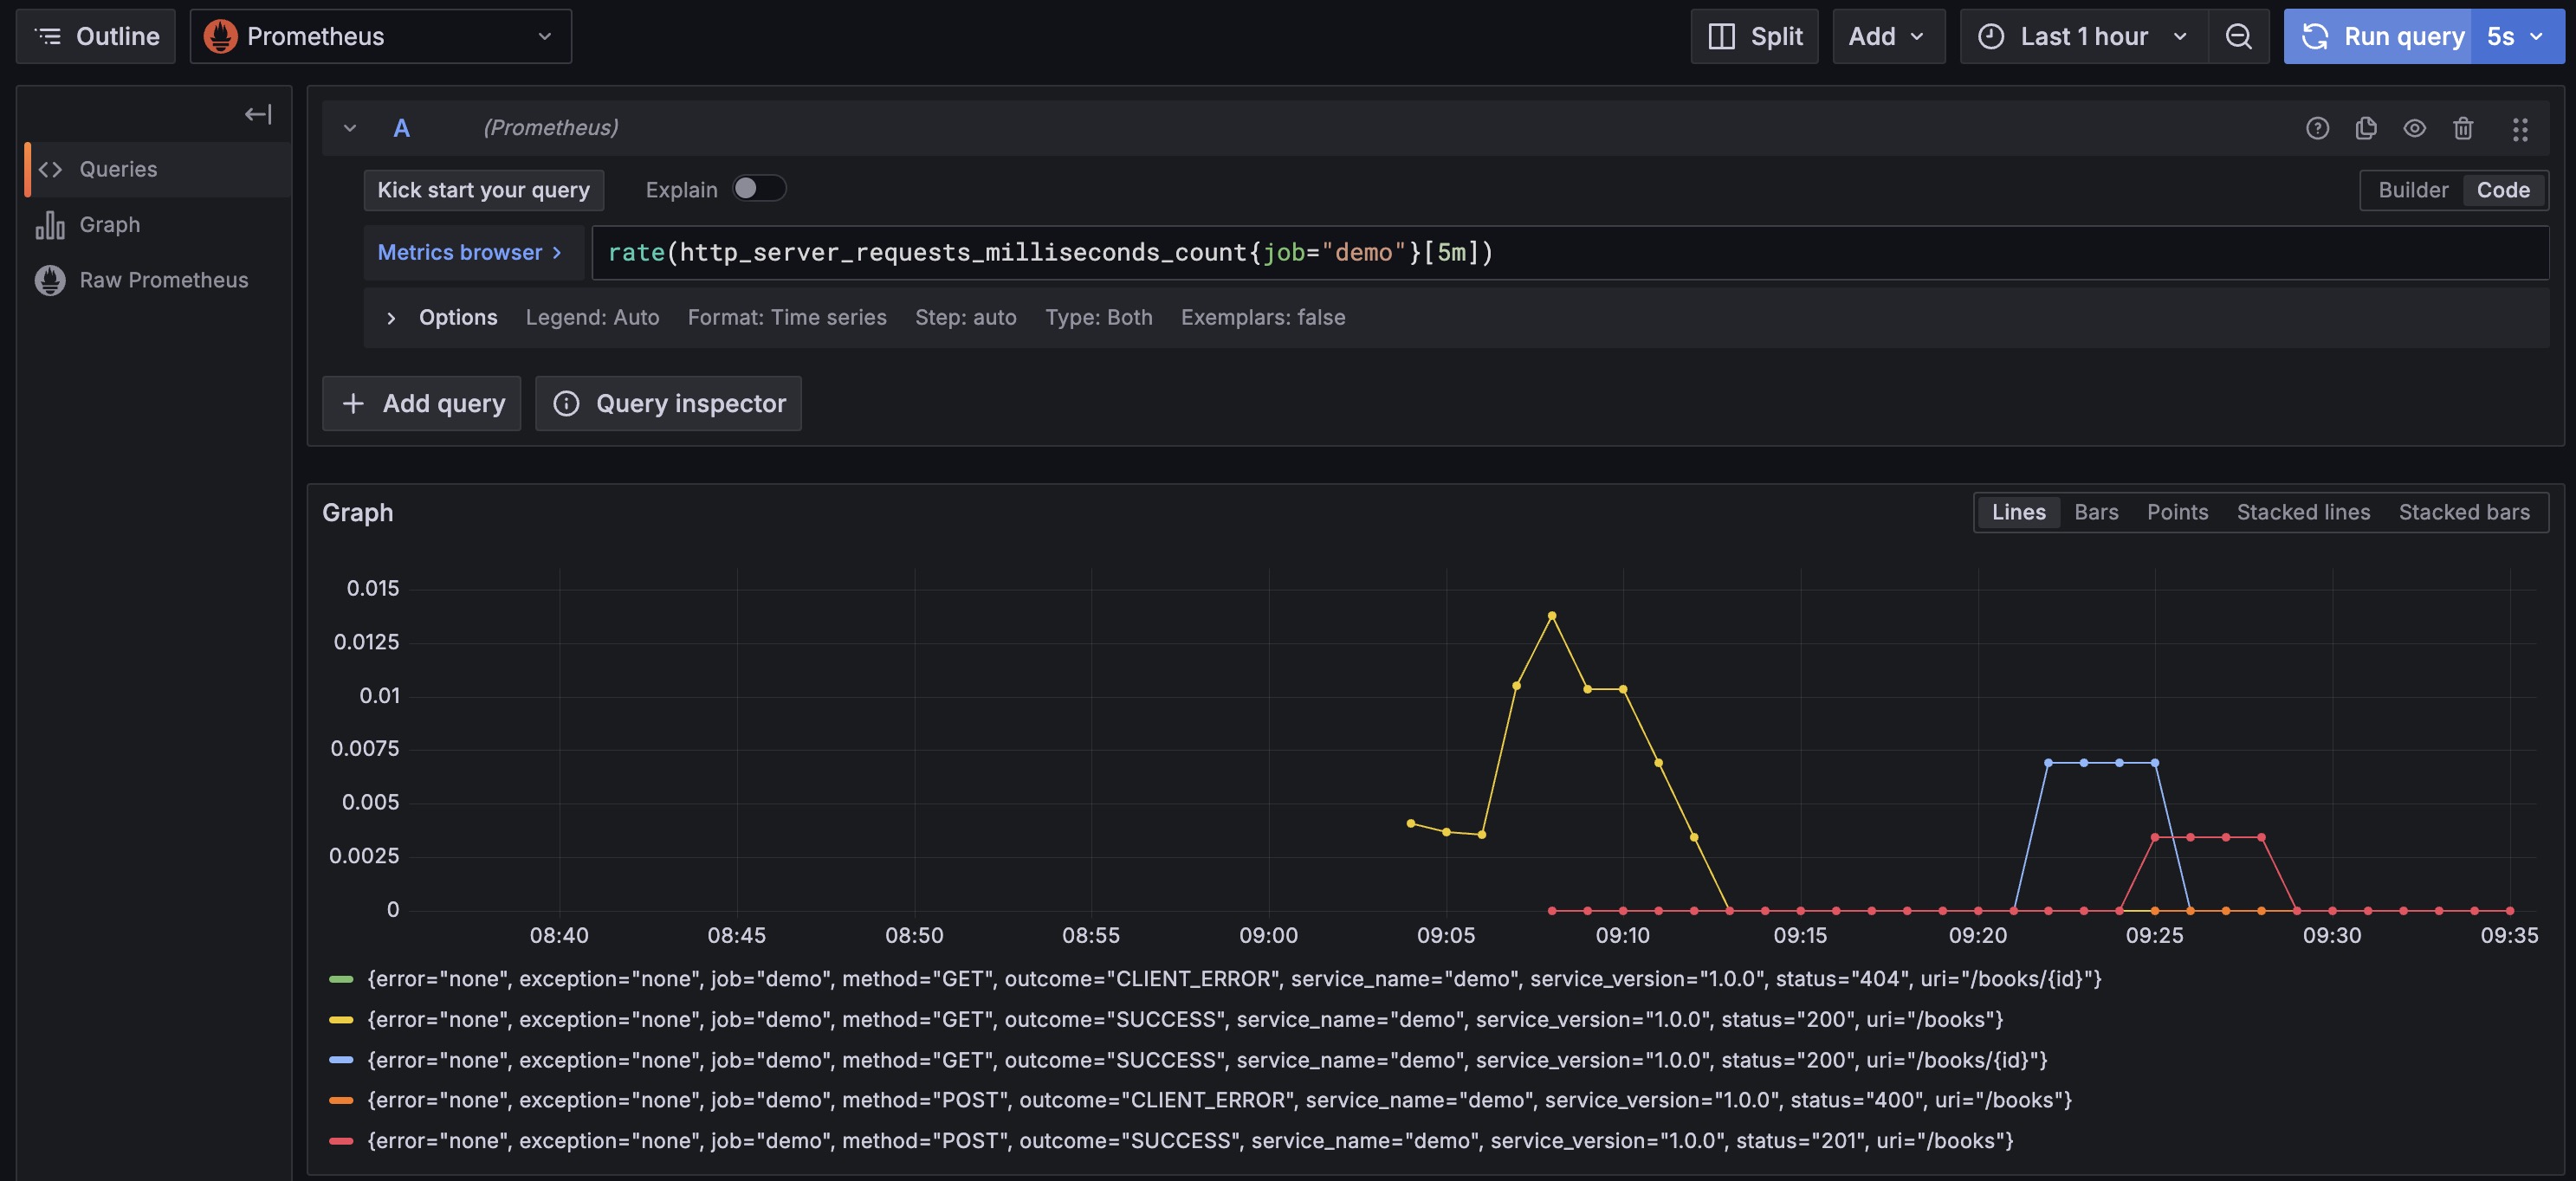
Query “View Book Details” P95 Latency (in milliseconds):
1
histogram_quantile(0.95, sum(rate(book_details_view_milliseconds_bucket{job="demo"}[5m])) by (le))
This is an advanced query using histogram (
_bucket) data to calculate the 95th percentile latency for “View Book Details” operations in milliseconds.Analyze with Custom Tags:
We definedlowCardinalityKeyValuesin@Observed, likeoperation="get_by_id". This tag enables more detailed analysis.1
2// Calculate total count of all "get_by_id" operations in the past 5 minutes
sum(increase(book_details_view_milliseconds_count{job="demo", operation="get_by_id"}[5m]))
The Magic of Exemplars
In Grafana’s chart panels, if you see a colored diamond icon next to a data point, that’s an Exemplar. It’s a specific trace sample associated with that time point’s metric data. When you see a spike in the latency chart, you can click the diamond icon on that spike, and Grafana will immediately take you to the complete trace view of the request that caused this latency spike. This feature dramatically shortens the path from “finding problems” to “locating problems”.
Log Correlation: Using Loki and LogQL
Finally, select the loki data source. We use LogQL to query logs.
To enable logs to be successfully collected and parsed by the backend otel-lgtm, you need to enable Spring Boot’s file logging and set its format to logstash JSON. This ensures all file-written logs have the structured format that Loki loves. You can achieve this by adding configuration like this in application.yml:
1 | logging: |
After configuration, thanks to OpenTelemetry’s automatic integration, key tracing information like trace_id and span_id is automatically added to JSON logs, making log-trace correlation incredibly powerful.
Query All Application Logs:
Thespring.application.namedefined inapplication.ymlis automatically mapped to theservice_namelabel in Loki. This is the most direct way to filter specific application logs.1
{service_name="demo"}
Trace to Logs:
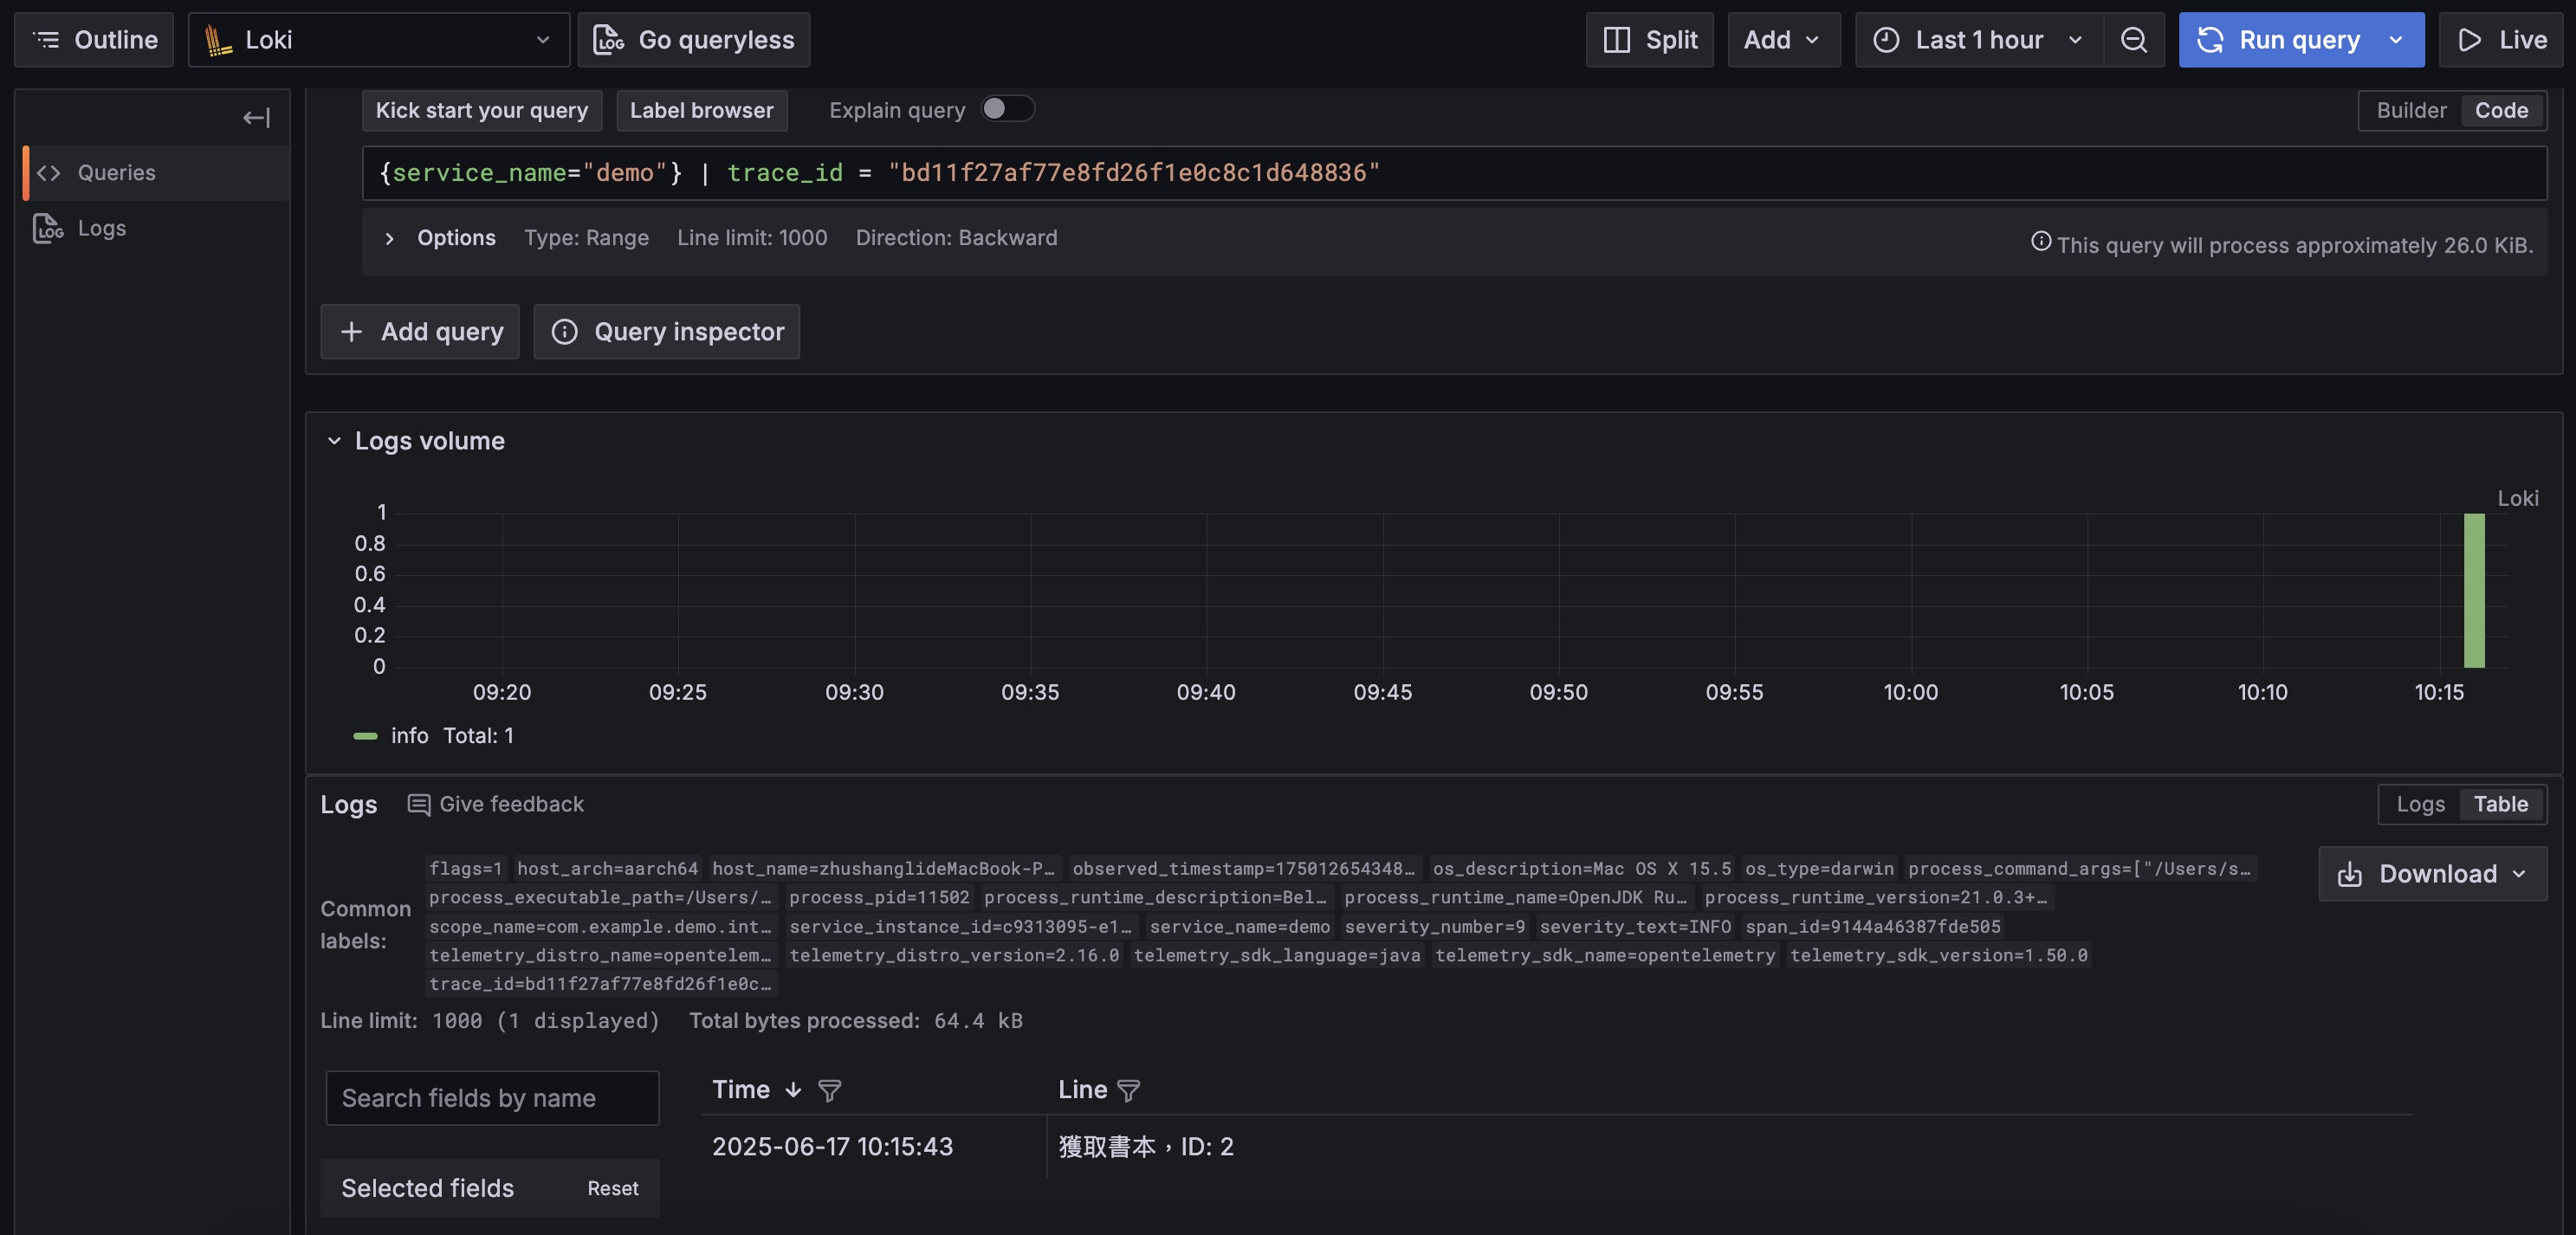
This is the most commonly used feature. Sincetrace_idis already included in our JSON logs, the log agent inotel-lgtmintelligently extracts it as an indexable label. Therefore, in Tempo’s trace waterfall chart, click any Span, then click the “Logs for this span” button, and Grafana can still precisely filter all related logs.Manually Query Logs by Trace ID:
You can also copy atrace_idfrom Tempo and directly use this label to query in Loki, which is more efficient than parsing full text.1
{service_name="demo", trace_id="copied_trace_id"}
If you want to further process log JSON content (e.g., only show the
messagefield), you can addjsonandline_formatfilters:1
{service_name="demo", trace_id="copied_trace_id"} | json | line_format "{{.message}}"
🔬 Modern Observability - Part 4: Full-Stack Tracing with Grafana Faro Integration (Optional)
In modern web applications, monitoring only backend services isn’t enough. Complete observability needs to cover the full chain from user browser to backend database. This project demonstrates how to use Grafana Faro for frontend observability and seamlessly integrate with backend OpenTelemetry tracing.
Grafana Faro Integration Implementation
Frontend Tracing Configuration (src/main/resources/static/index.html)
We’ve integrated Grafana Faro in the frontend page for complete frontend observability:
1 | <!-- Load Grafana Faro CDN packages --> |
Automatic Frontend-Backend Trace Correlation
When a user clicks the “Get Books” button, Faro’s TracingInstrumentation automatically:
- Creates Frontend Span: Records user action and API request
- Injects traceparent Header: Automatically adds tracing context to
fetch('/books')request - Correlates Backend Trace: Spring Boot receives the traceparent header and creates correlated backend Span
1 | // Actual event handling logic |
Full-Stack Trace Effect in Tempo
After integrating Grafana Faro, you can see complete frontend-backend trace chains in Tempo:
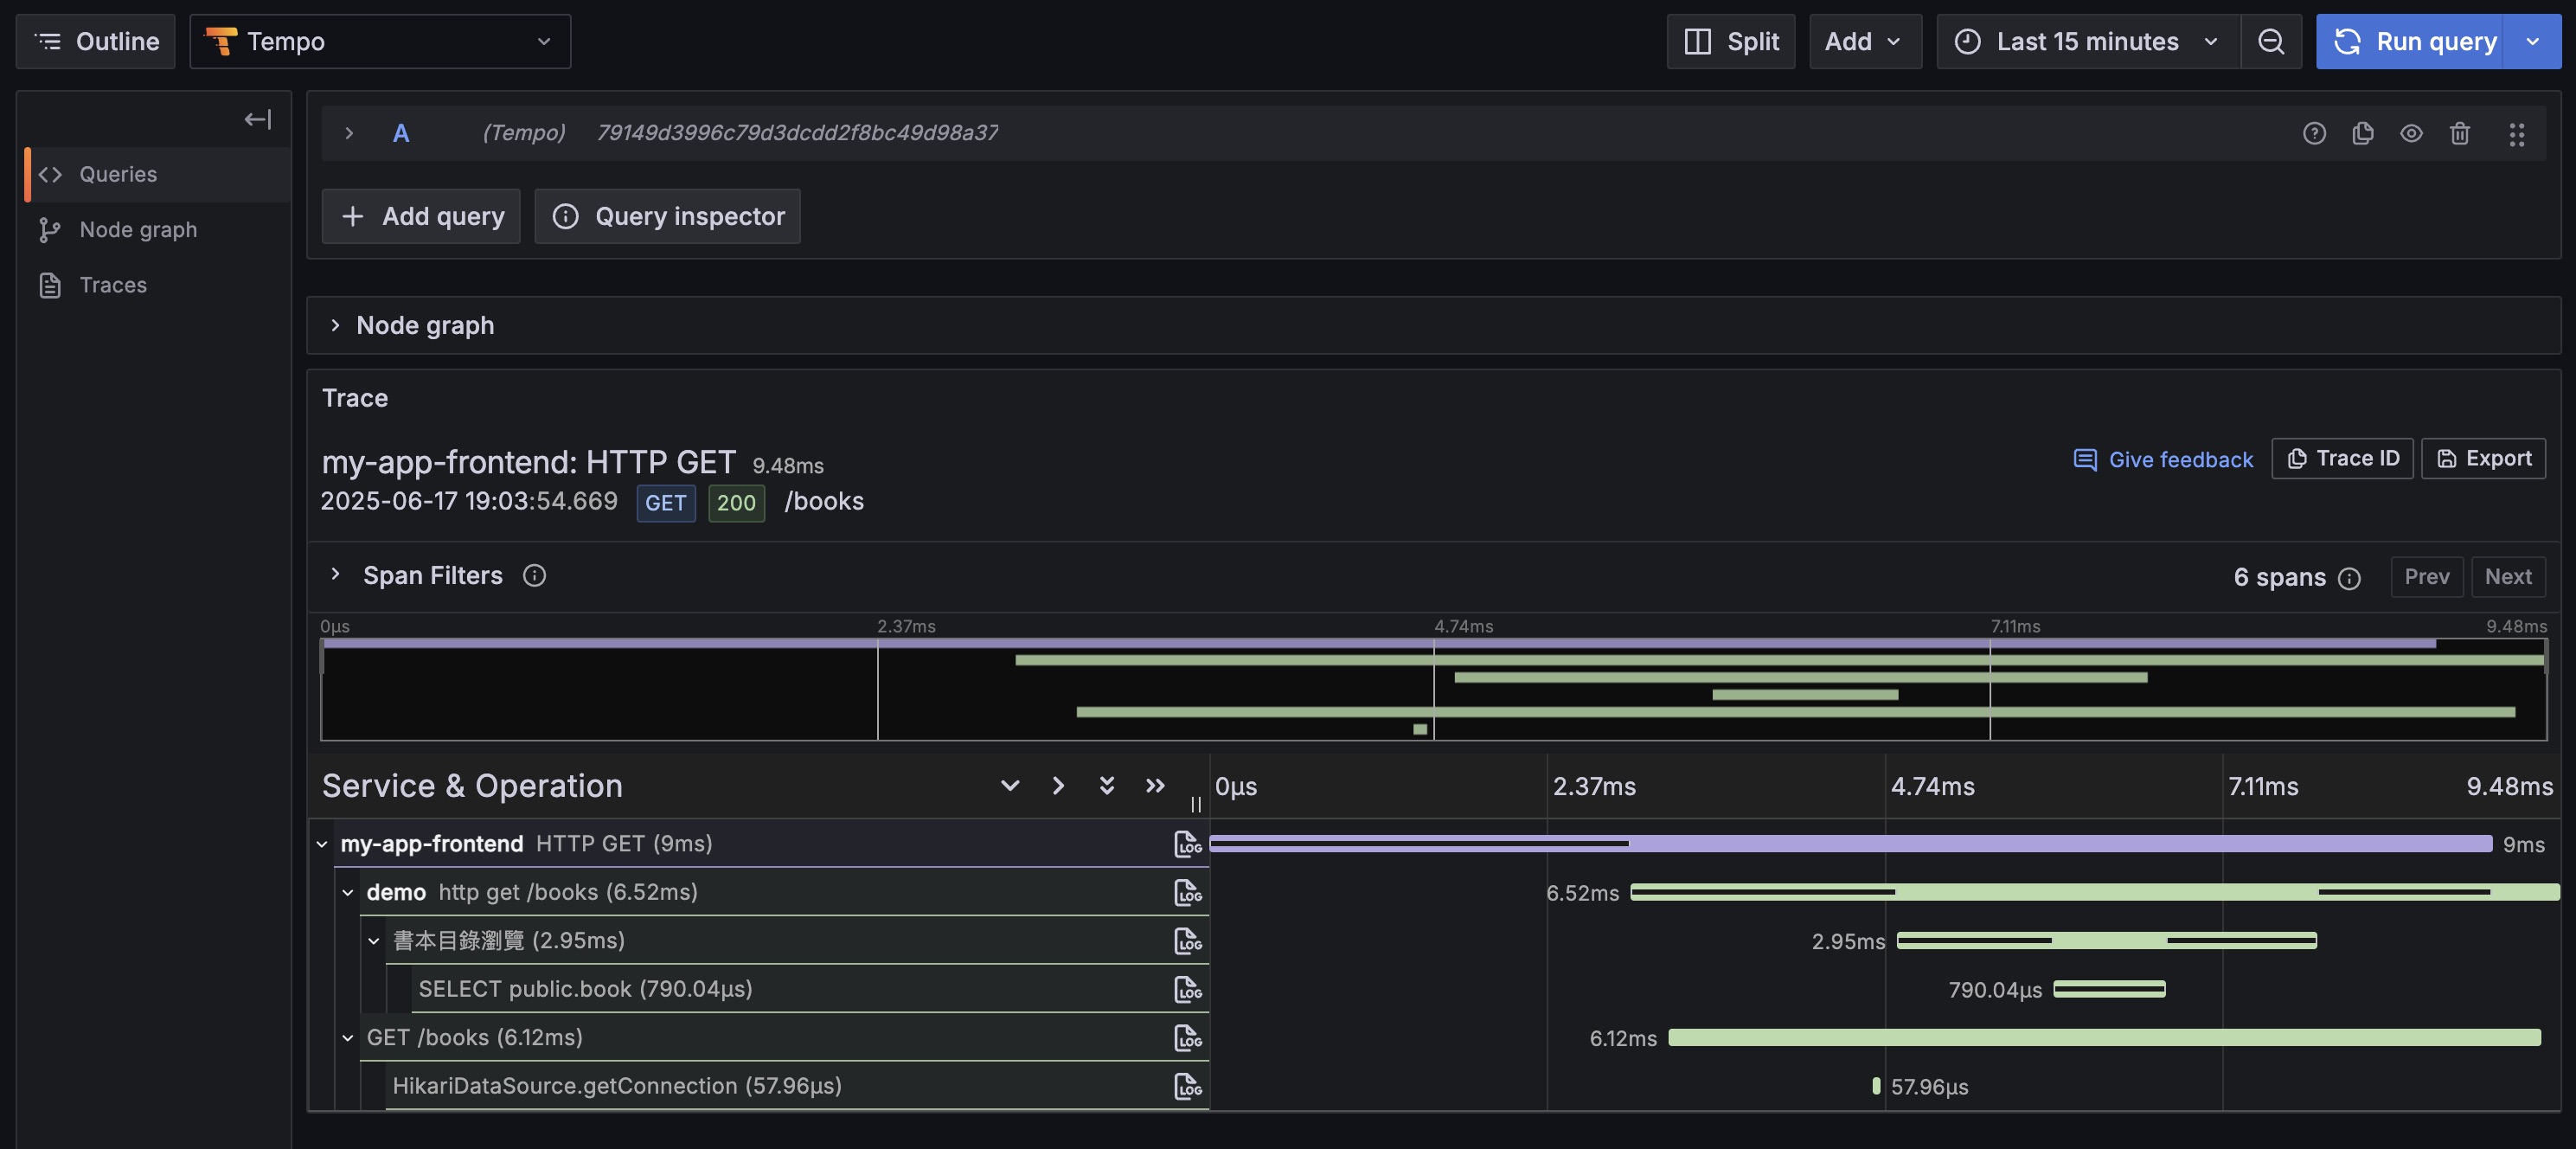
As shown, you can now query in Tempo:
- Frontend Service (
my-app-frontend): User interactions, page loads, API requests - Backend Service (
demo): API processing, business logic, database operations - Complete Chain: End-to-end tracing from user click to database query
Useful Full-Stack Trace Queries
1. Query Frontend Traces
1 | {resource.service.name="my-app-frontend"} |
2. Query Backend Traces
1 | {resource.service.name="demo"} |
3. Query Complete Frontend-Backend Chains
1 | {resource.service.name="my-app-frontend" || resource.service.name="demo"} |
4. Analyze Cross-Service Performance
1 | {(resource.service.name="my-app-frontend" || resource.service.name="demo") && duration>1s} |
5. Trace Specific Business Operations
1 | {resource.service.name="demo" && name="View Book Details"} |
Faro Integration Advantages
- Zero-Config Auto-Correlation: Frontend and backend traces automatically correlate via
traceparentheader - Complete User Experience: Full view from browser click to database query
- Unified Monitoring Platform: Frontend and backend data converge to the same Grafana/Tempo platform
- Rich Context: Complete context combining frontend user behavior and backend business logic
Real-World Application Scenarios
- User Experience Analysis: Analyze complete timeline from user click to page update
- Performance Bottleneck Location: Quickly determine if slow requests are frontend or backend issues
- Error Root Cause Analysis: Trace complete error propagation chain from frontend to backend
- Business Process Monitoring: Monitor critical business process execution across frontend and backend
Through Grafana Faro integration, we achieve true full-stack observability, providing a complete monitoring solution for modern web applications.
Environment and Configuration
Containerized Environment (compose.yaml)
We use Docker Compose to start all required external services with one click, including postgres (database), redis (cache), and otel-lgtm (monitoring backend). This lets any developer quickly set up a complete development and testing environment on their machine.
Application Configuration (application.yml)
This is the project’s control center, defining various application behaviors. By now, you should better understand how each setting corresponds to the technologies discussed in previous sections:
spring.application.name: demo: Very important. This name becomesservice.namein OpenTelemetry, your basis for filtering services in Grafana.spring.threads.virtual.enabled: true: Enable Java 21 virtual threads for improved throughput. See 🚀 Performance Boost section.management.observations.annotations.enabled: true: Master switch for@Observedannotations. See 🔬 Observability section.management.opentelemetry.resource-attributes: Adds extra tags to all outgoing monitoring data, like service version and deployment environment, for easier backend filtering.management.tracing.sampling.probability: 1.0: Sampling rate set to1.0(100%). Useful for development and testing to ensure every request trace is recorded. In production, usually set lower (e.g.,0.1) for performance and cost considerations.management.otlp.*.endpoint: Explicitly specifies where to send Metrics, Traces, and Logs. Here we point tootel-lgtmcontainer’s port 4318.spring.jpa.hibernate.ddl-auto(not set toupdateorcreate): We give database structure management completely to Liquibase for rigorous version control.
Monitoring
1 | curl -X GET http://localhost:8080/actuator/health |
1 | { |
Readiness Probe
1 | curl -X GET http://localhost:8080/actuator/health/readiness |
1 | { |
Liveness Probe
1 | curl -X GET http://localhost:8080/actuator/health/liveness |
1 | { |
SBOM Information
1 | curl -X GET http://localhost:8080/actuator/sbom/application |
1 | { |
Git Information
1 | curl -X GET http://localhost:8080/actuator/info |
1 | { |
VS Code Extension Recommendations
📋 Best Practices Checklist
Development Phase
- Run
./gradlew clean openApiGenerateafter modifyingopenapi.yaml - Set appropriate TTL when adding cache
- Add
@Observedannotation to important business logic
Deployment Phase
- Use different configuration files for different environments
- Use environment variables or Secret Manager for sensitive information
- Set appropriate trace sampling rate (0.1 recommended for production)
📚 Further Learning Resources
Official Documentation
Summary
This guide demonstrates how to integrate a series of modern tools and practices to build a Spring Boot project that’s not just feature-complete but also considers performance, maintainability, and observability.
For developers, evolving from “getting features done” to “doing quality work” requires consciously adopting these modern practices:
- Embrace Java 21 virtual threads for simpler code and higher system throughput
- Use Liquibase for database version control to ensure team collaboration and multi-environment deployment consistency
- Practice API-First development workflow to establish clear service contracts and accelerate team parallel development
- Leverage tools like MapStruct and Spring Cache to eliminate repetitive boilerplate code and effectively improve application performance
- Build comprehensive observability system through Micrometer and OpenTelemetry to deeply understand system internal behavior, transforming passive “debugging” into proactive “performance optimization” and “problem prevention”
Remember: Good programs don’t just run - they run stably, run fast, and problems can be quickly located when they occur!
Incorporating these practices into daily development helps improve final product quality and development team productivity. Hope this guide provides useful reference for your next project.
The complete source code is available at github.com/samzhu/demo-springboot-250613. If this guide helped you, feel free to share with other developers. Questions or suggestions? Welcome to raise Issues or Pull Requests! 🙌